Introduction
One of these random days I asked myself, how fast can a FastAPI application go? How many request per second can be achieved using a simple setup. I know request per second is not a measure of anything, particularly if I test it on my machine as opposed to a production environment. However, the doubt still stands, and I was set to not scientifically try to figure it out and learn something in the process.
I tried to find something to check the RPS of an application, and my first findings pointed me to Apache JMeter, but after some finagling with it I asked a friend and they pointed me to locust. Locust is an open source tool written in python that would get you results easier than JMeter ever would.
Tools out of the way, I would like to take you through the some of the code we’re going to be testing and then the results and the learnings we could derive from it.
Code and partial results
Ping test
For the code, let’s start with something super simple to stablish a baseline. Since the api and the meter will be running in the same computer I would like to know where does the RPS saturate.
Here’s the project structure for our little app you can find in the repo.
fast-api-load on main 🐍
❯ tree
.
├── Dockerfile
├── README.md
├── compose.yaml
├── migrations
│ ├── 000001_initial.down.sql
│ └── 000001_initial.up.sql
├── pyproject.toml
├── src
│ └── example
│ ├── __init__.py
│ ├── api.py
│ ├── config.py
│ ├── exceptions.py
│ ├── models.py
│ ├── repositories.py
│ └── utils.py
└── uv.lock
4 directories, 14 filesFrom there, let’s define a simple ping endpoint to stablish a baseline,
# api.py

from fastapi import FastAPI
from example.models import PongModel

app = FastAPI()

@app.get("/ping/")
async def ping() -> PongModel:
    """Ping endpoint to check if the server is up and running."""
    return PongModel(ping="pong")
And then let’s run it using docker compose:
# compose.yaml

services:
  api:
    build: .
    command: ["uv", "run", "uvicorn", "--host", "0.0.0.0", "example.api:app"]
    ports:
      - "8000:8000"
    develop:
      # ...
Notice we’re running the app using uvicorn instead of
FastAPI’s own development server. I tried using the dev server, and
the results were just not fair to show.
Finally, to load test the application using locust, we’re going to
need a locustfile.py,
# locustfile.py

from locust import HttpUser, task

class HelloWorldUser(HttpUser):
    """User class for the test."""

    @task
    def hello_world(self) -> None:
        """Task to test the hello world page."""
        self.client.get("/ping/")
And then we can run the test using the uvx locust command. Then I set the
maximum concurrency to 200 and the load to scale at 20 concurrent threads a
second. The first set of results are a bit interesting:
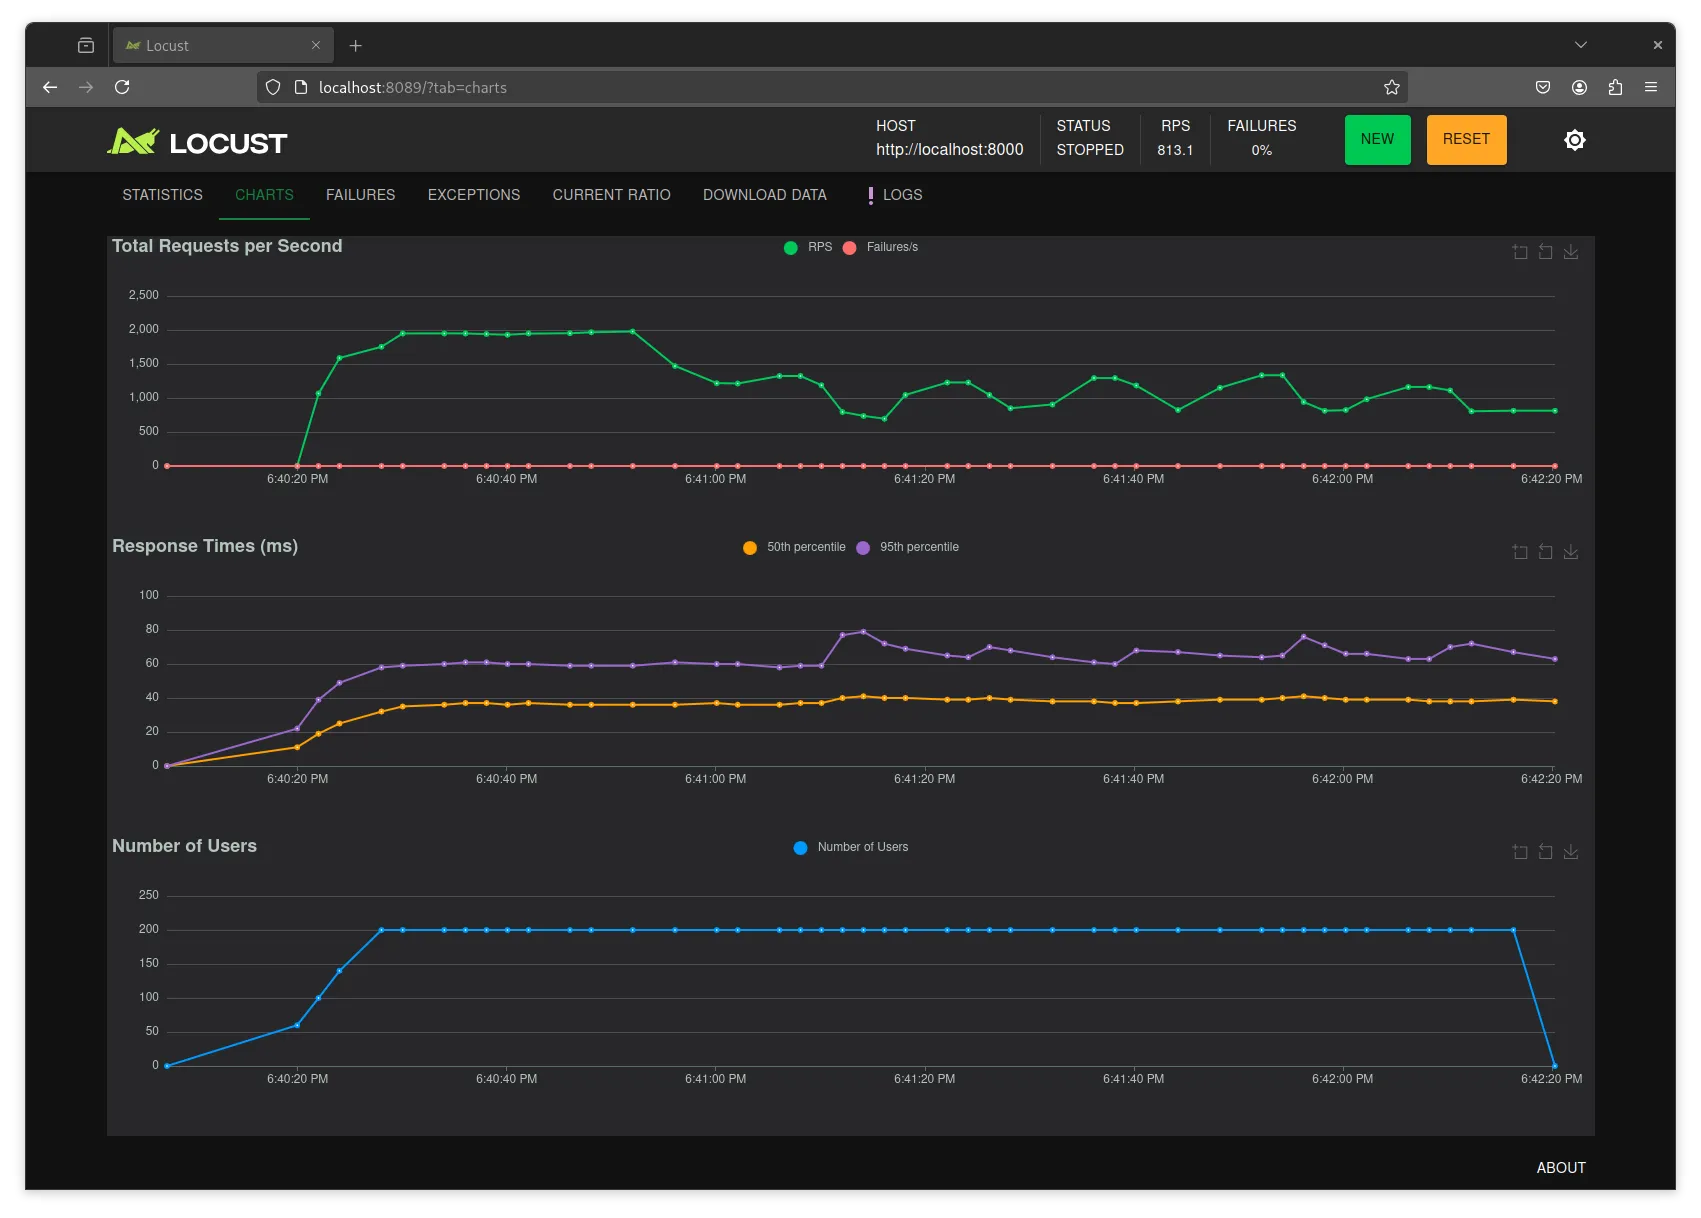
Here you can see that the RPS temporarily saturates at 2000 but then falls down
and oscillates between 800 and 1200. I noticed my terminal was struggling to
keep up with the logs. Then, I tried disabling the access logs from
uvicorn adding the following command to the compose.yaml file:
# compose.yaml

services:
  api:
    build: .
    command:
      [
        "uv",
        "run",
        "uvicorn",
        "--host",
        "0.0.0.0",
        "--log-level",
        "error",
        "example.api:app",
      ]
    ports:
      - "8000:8000"
    # ...
Furthermore, I added more threads to locust to avoid saturating the
capacity for it to send requests. From now on the command for it looks like
uvx locust --processes 8. In my case I’m running a 12 thread CPU,
uvicorn uses one, and I give 8 to locust, leaving 3 to
power my desktop environment and other activities.
Interestingly enough, without the access logging, we got some other interesting results:
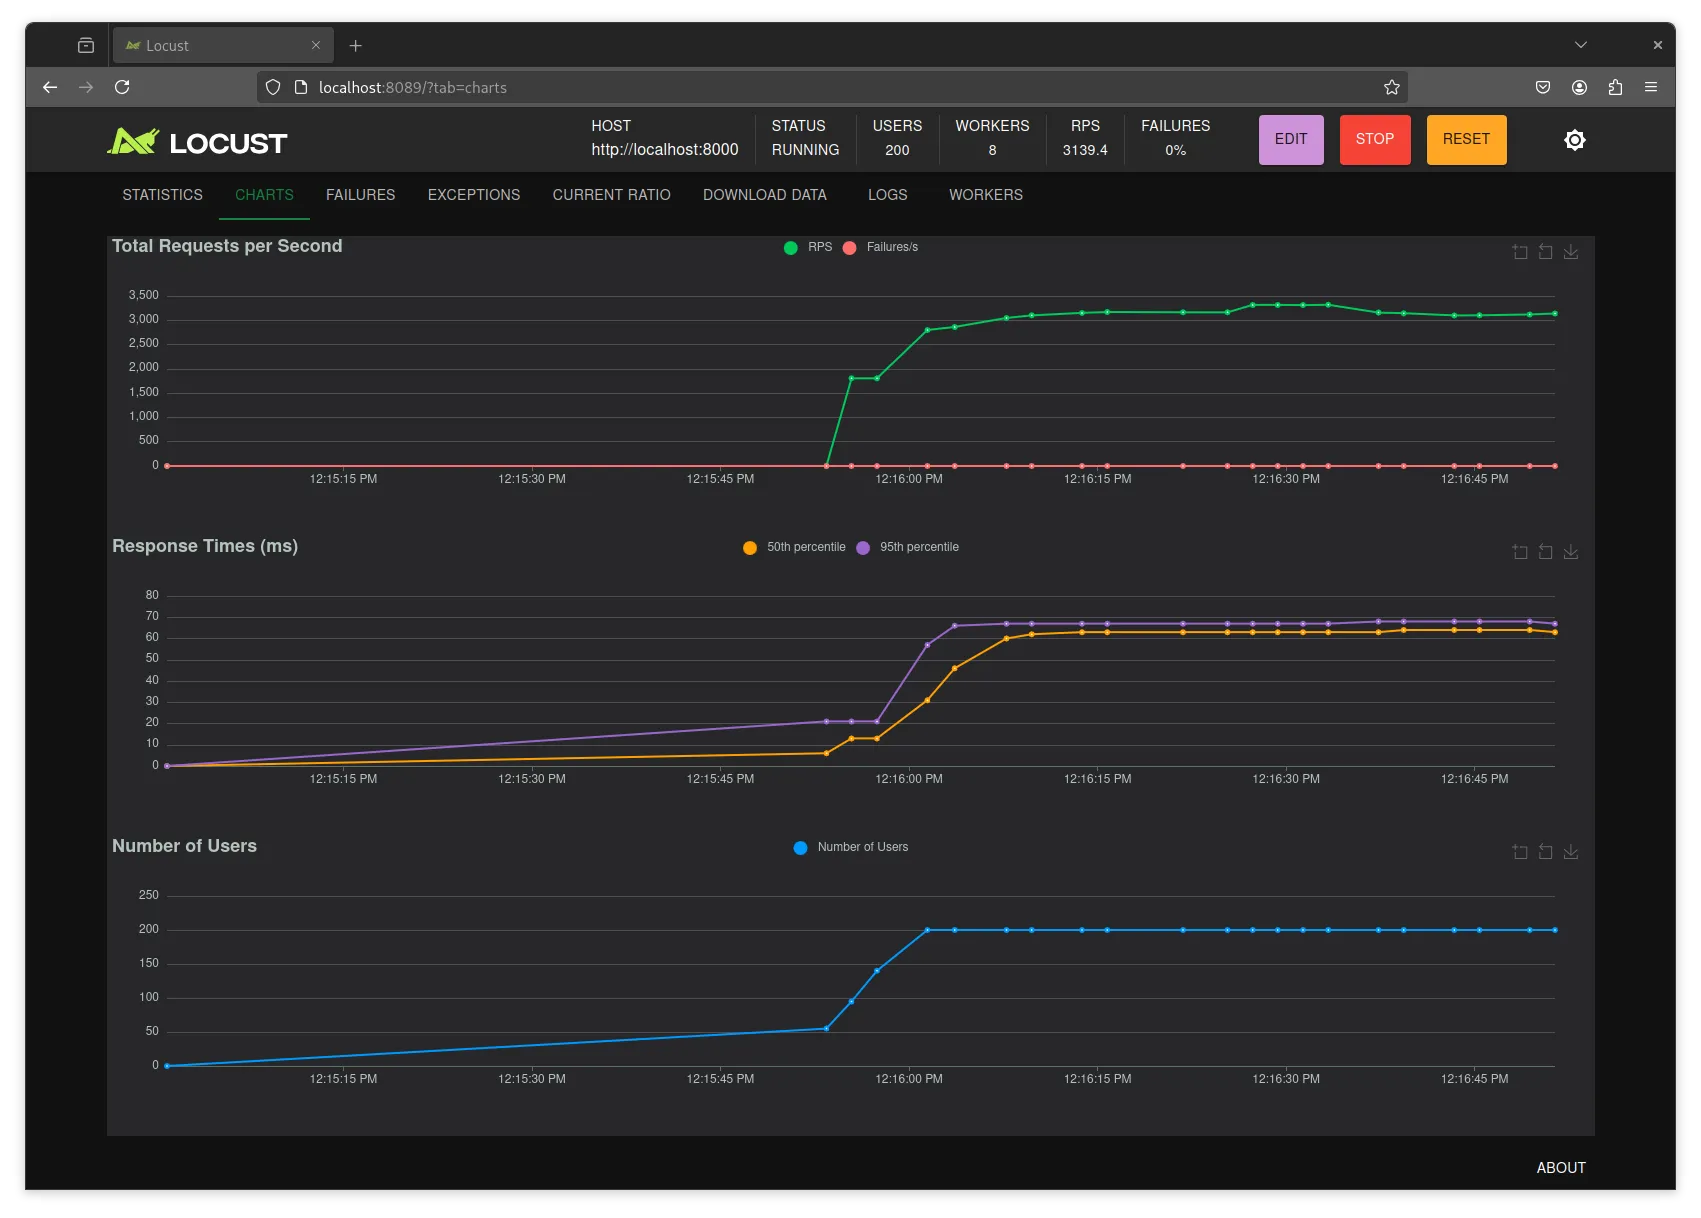
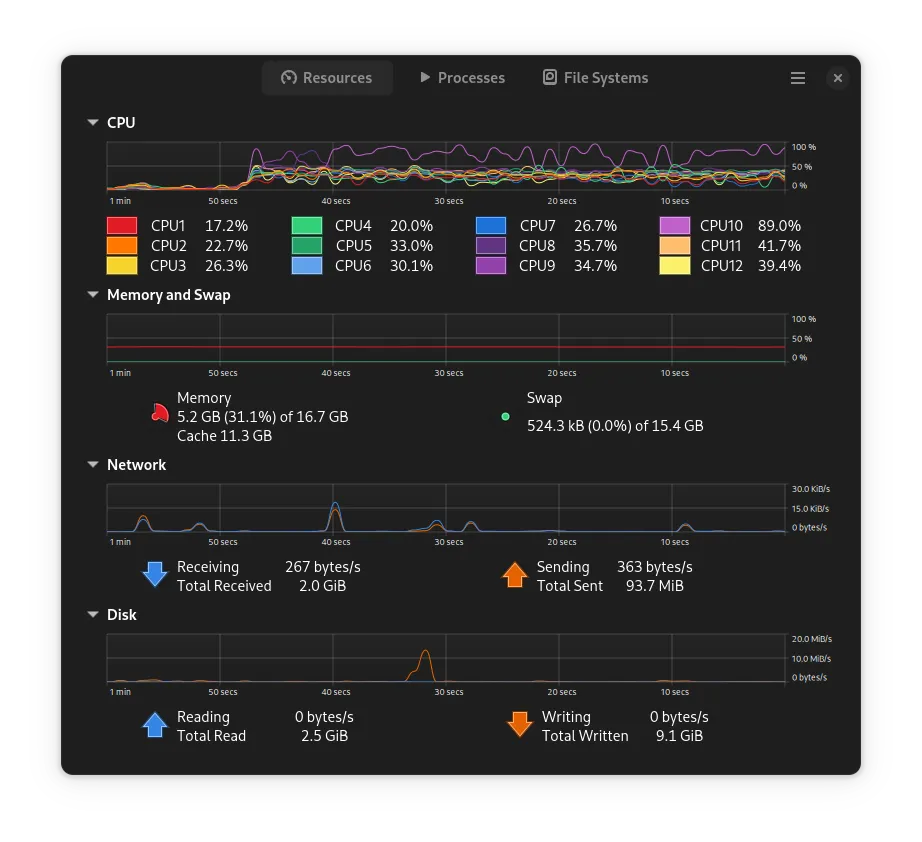
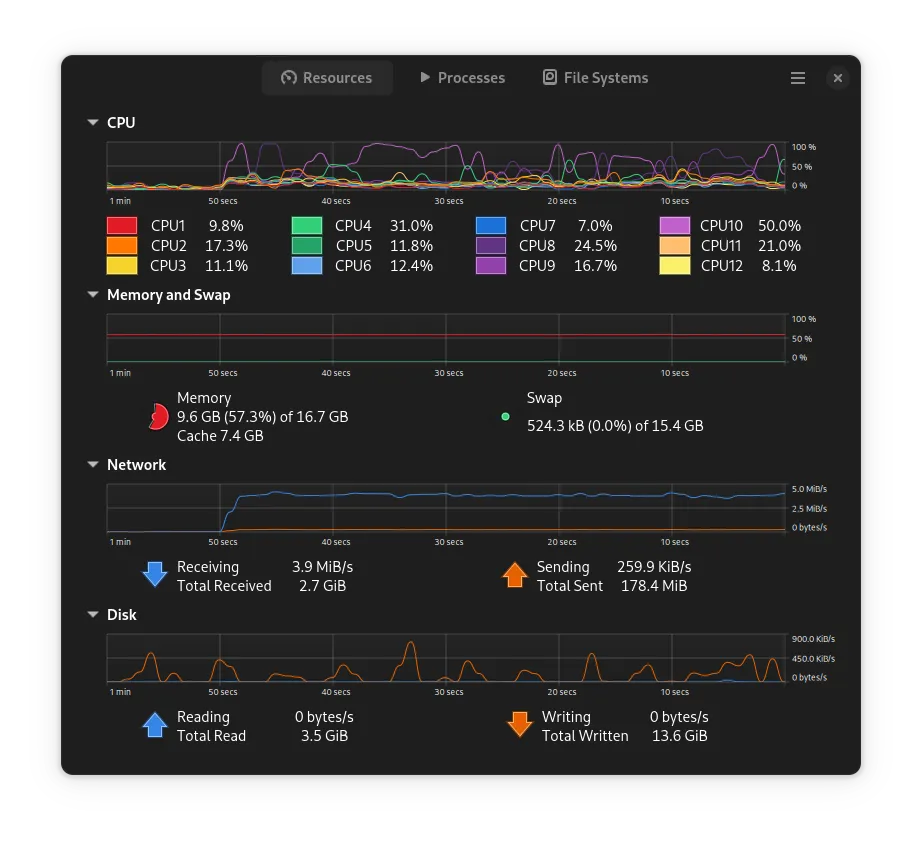
Here we see that the RPS saturate at 3100 and no longer drops down. However, if we check the network performance of the computer during the test:
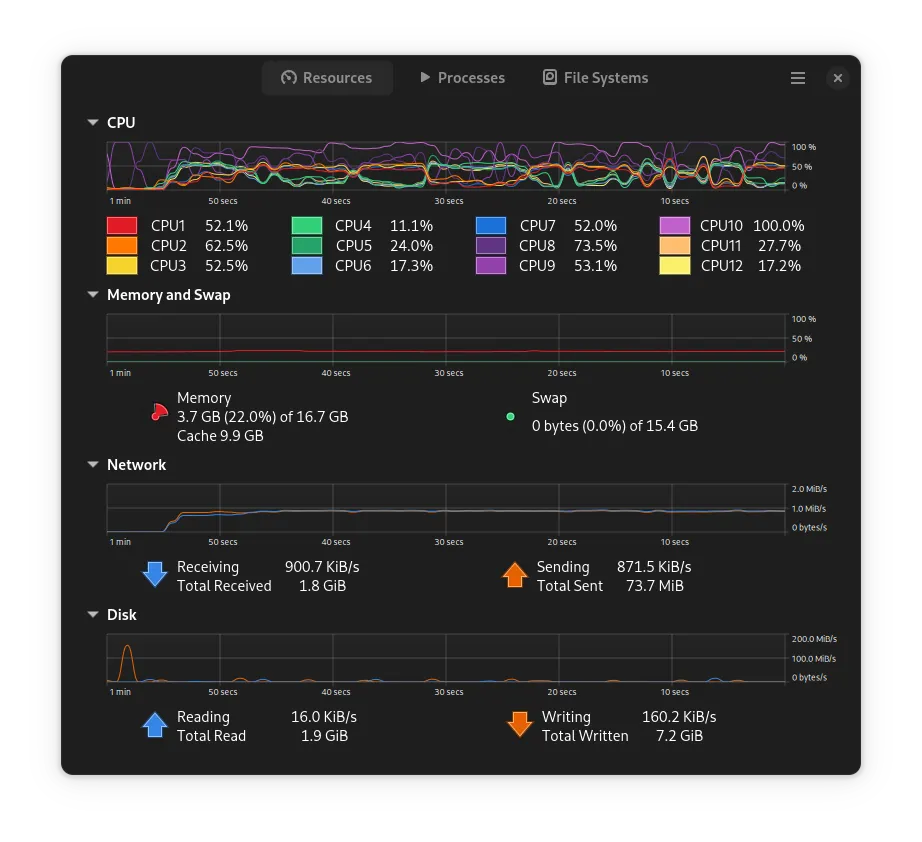
We notice that we are sending/receiving at 900KiB/s, which I think is the limit for my not impressive network card.
For completeness, let’s take docker out of the picture and see if we get
better performance without using the network card. For that I can run the
following command directly:
uv run uvicorn --log-level error example.api:appWith that we get significantly more performance out of the app:
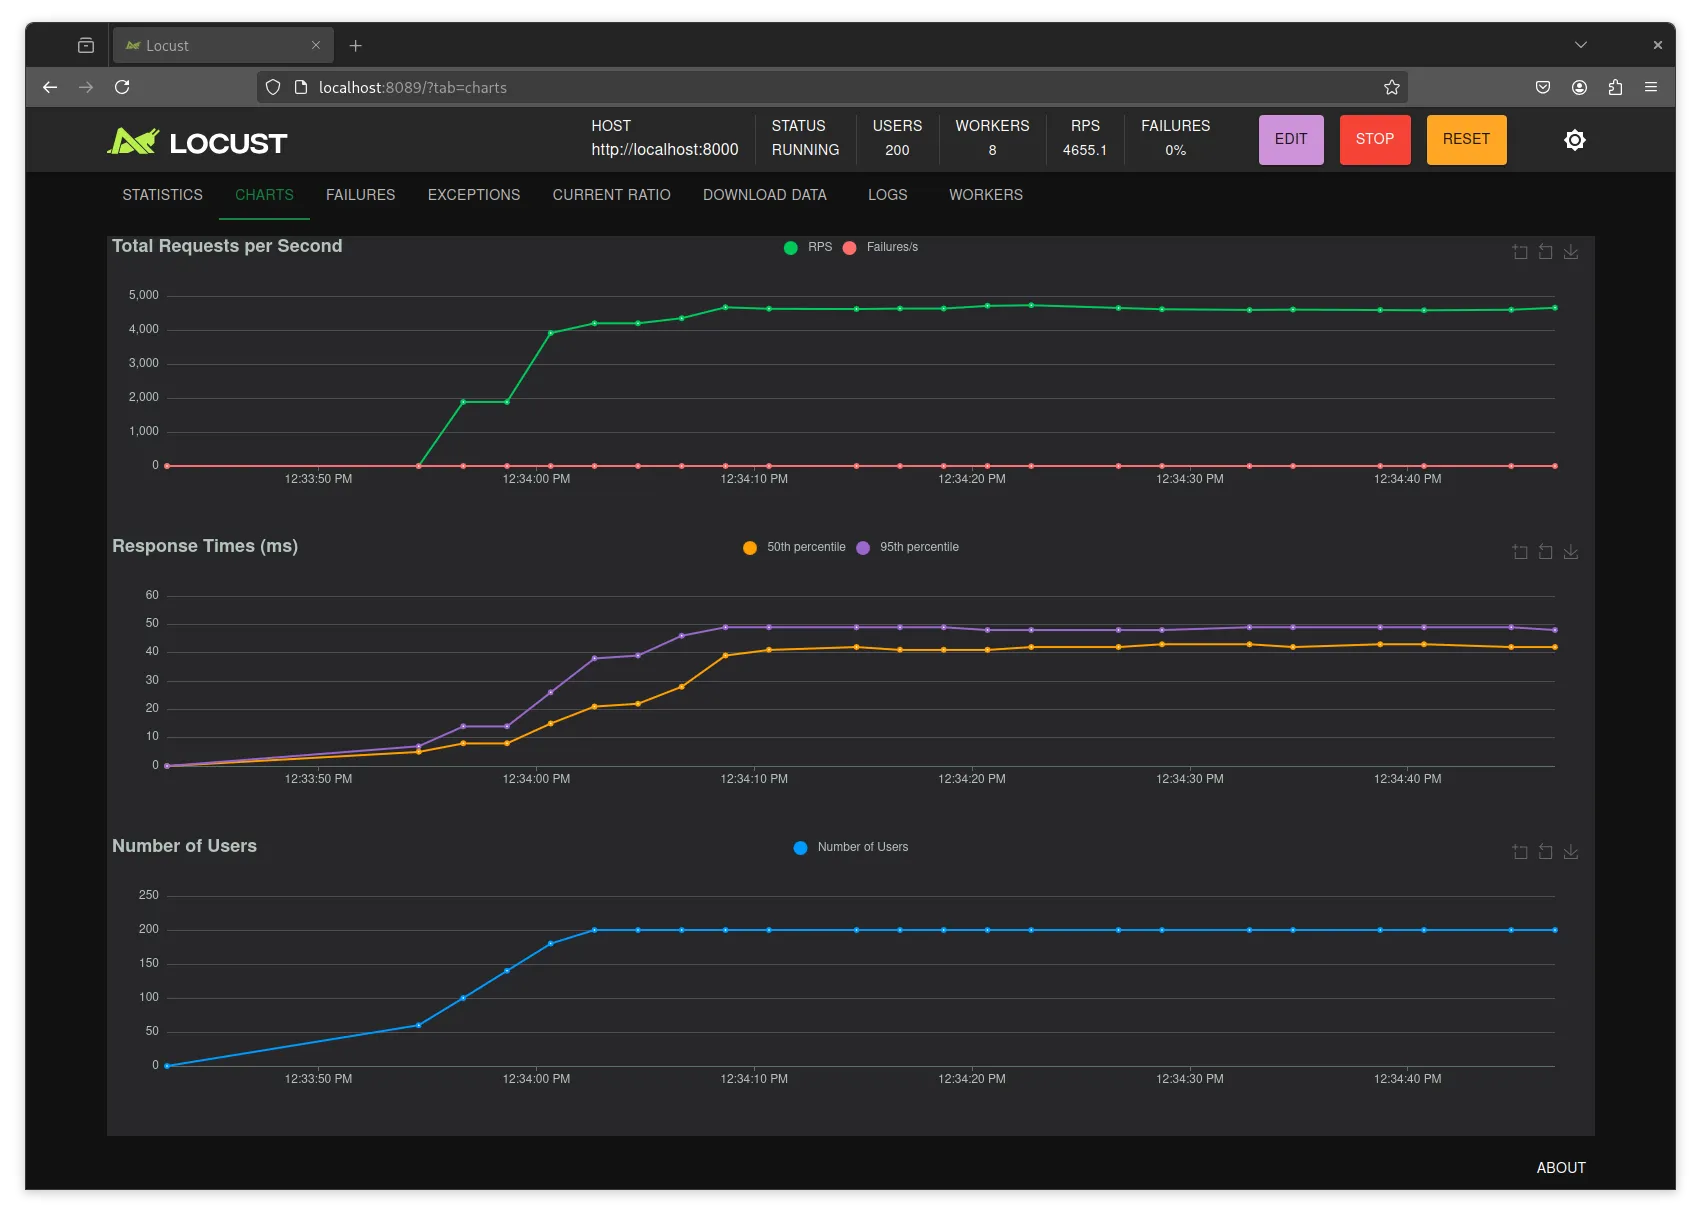
Saturating at about 4700 RPS. And as we can see, the system load doesn’t show any network activity:
At this point I was curious to see how a compiled language (go) would behave under the same test, so I wrote a simple web server using the gin framework, the code looks like:
// main.go

package main

import "github.com/gin-gonic/gin"

func main() {
	router := gin.New()
	router.GET("/ping/", func(c *gin.Context) {
		c.JSON(200, gin.H{
			"ping": "pong!",
		})
	})
	router.Run(":8000")
}
And I ran it with GIN_MODE=release go run ., here are the results:
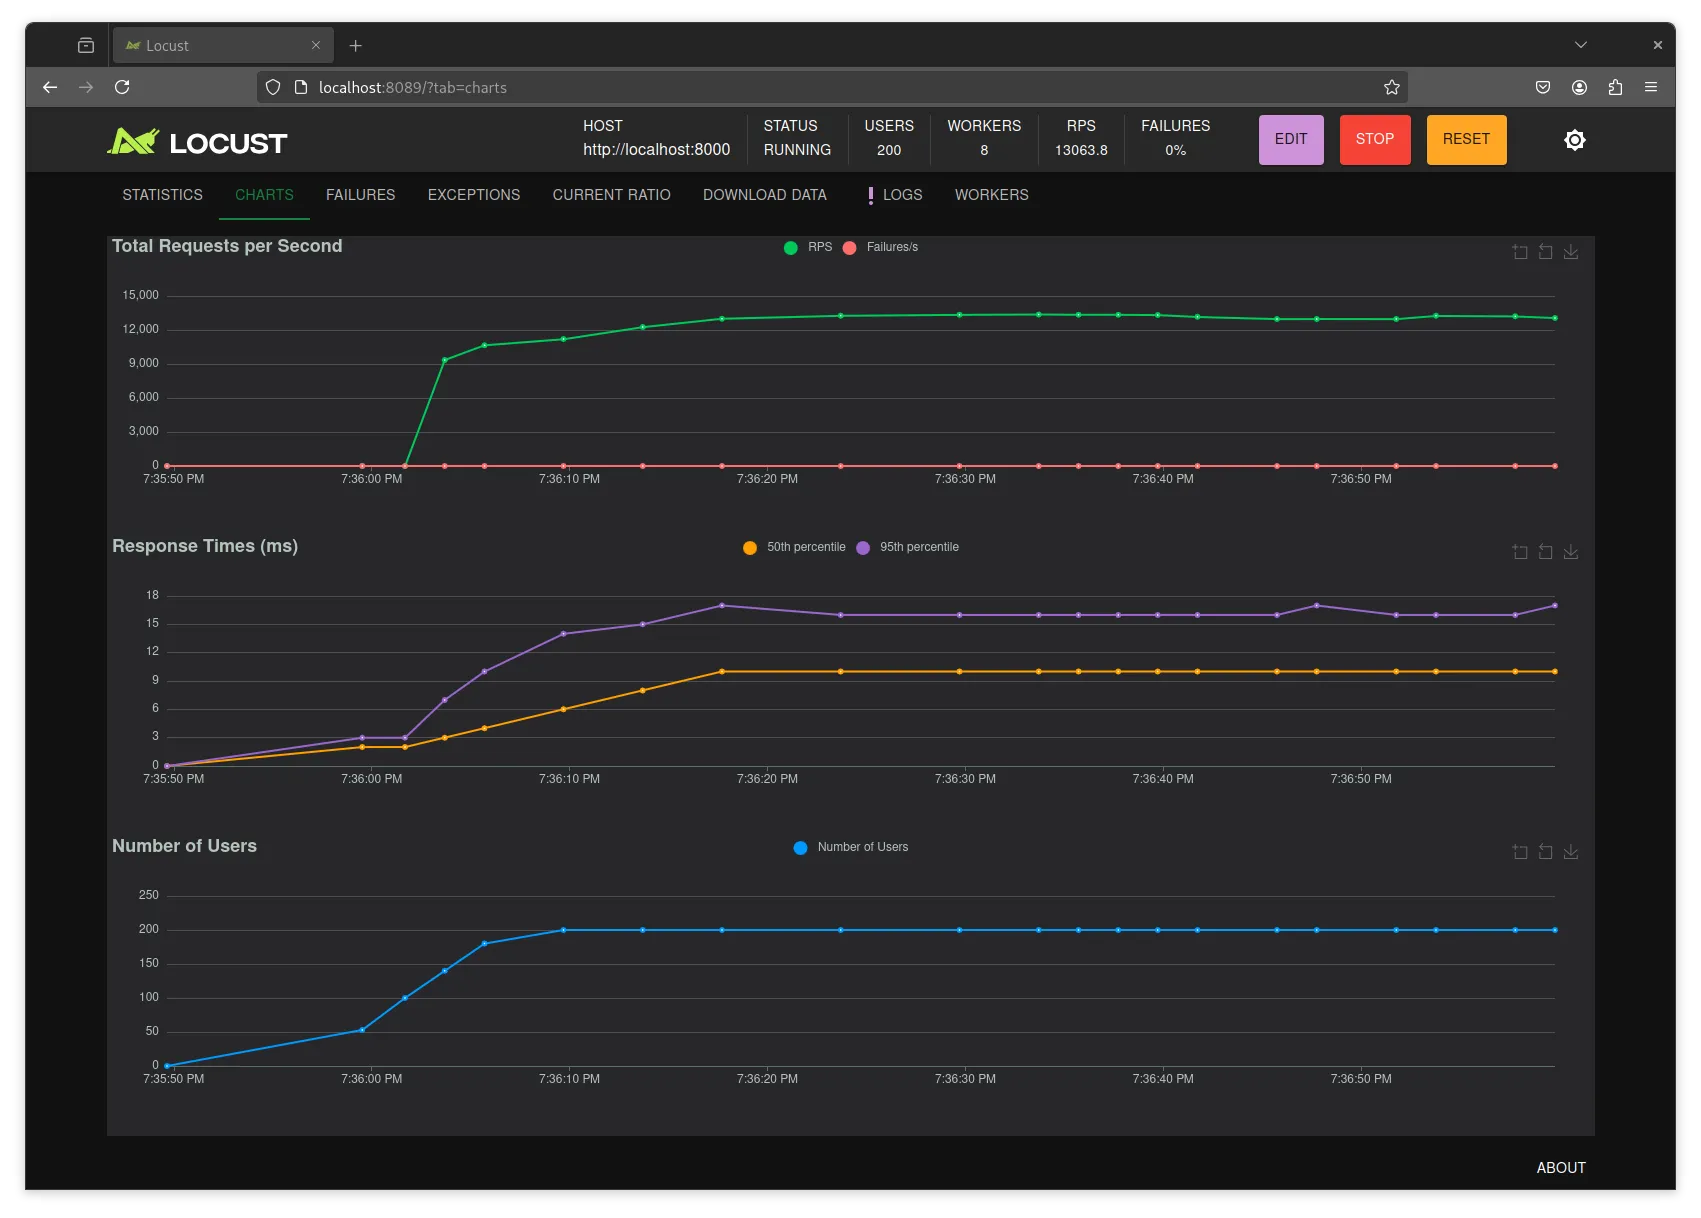
The results stabilize at 13000 RPS, however it seems like locust is just not capable of going faster than that given 8 threads. Producing the error:
CPU usage above 90%! This may constrain your throughput and may even give inconsistent response time measurements! See https://docs.locust.io/en/stable/running-distributed.html for how to distribute the load over multiple CPU cores or machinesNotice that for the ping test we can get away dropping docker, but for the database access test we’re going to need docker to host the database.
DB access test
Now with a baseline, let’s try a more complicated test: I added more endpoints to create and list “tasks” to the server.
# api.py

app = FastAPI()


async def get_config() -> Config:
    """Get the configuration."""
    return Config()  # type: ignore


async def get_db_connection(
    config: Annotated[Config, Depends(get_config)],
) -> AsyncGenerator[AsyncConnection, None]:
    """Get a database connection."""
    async with await AsyncConnection.connect(str(config.db_dsn)) as conn:
        yield conn


async def get_task_repository(
    conn: Annotated[AsyncConnection, Depends(get_db_connection)],
) -> TaskRepository:
    """Get a task repository."""
    return TaskRepository(conn)


@app.get("/tasks/")
async def list_tasks(
    repo: Annotated[TaskRepository, Depends(get_task_repository)],
    after: str | None = None,
    limit: Annotated[int, Query(ge=1, lte=100)] = 25,
) -> PaginatedTasks:
    """List tasks."""
    _after = 0
    if after is not None:
        _after = decode_next_id(after)
    return await repo.list(_after, limit)


@app.post("/tasks/", status_code=201)
async def create_task(
    repo: Annotated[TaskRepository, Depends(get_task_repository)],
    payload: CreateTaskPayload,
) -> Task:
    """Create a task."""
    return await repo.create(payload)
As you can see, this example “works” but it’s a little silly, on every request
we create a Config object, stablish a database AsyncConnection and create a
TaskRepository object. The silly stuff is mostly the connection which is
expensive to stablish and the configuration that never changes so it could be
generated just once.
Using postman I created a few tasks, enough to fill at least a page of the task
list endpoint and then changed locustfile.py to:
# locustfile.py

from locust import HttpUser, task

class HelloWorldUser(HttpUser):
    """User class for the test."""

    @task
    def hello_world(self) -> None:
        """Task to test the hello world page."""
        self.client.get("/tasks/")
And then run the test with uvx locust --processes 8 so that we don’t get the
90% CPU usage issue. This yields again interesting results:
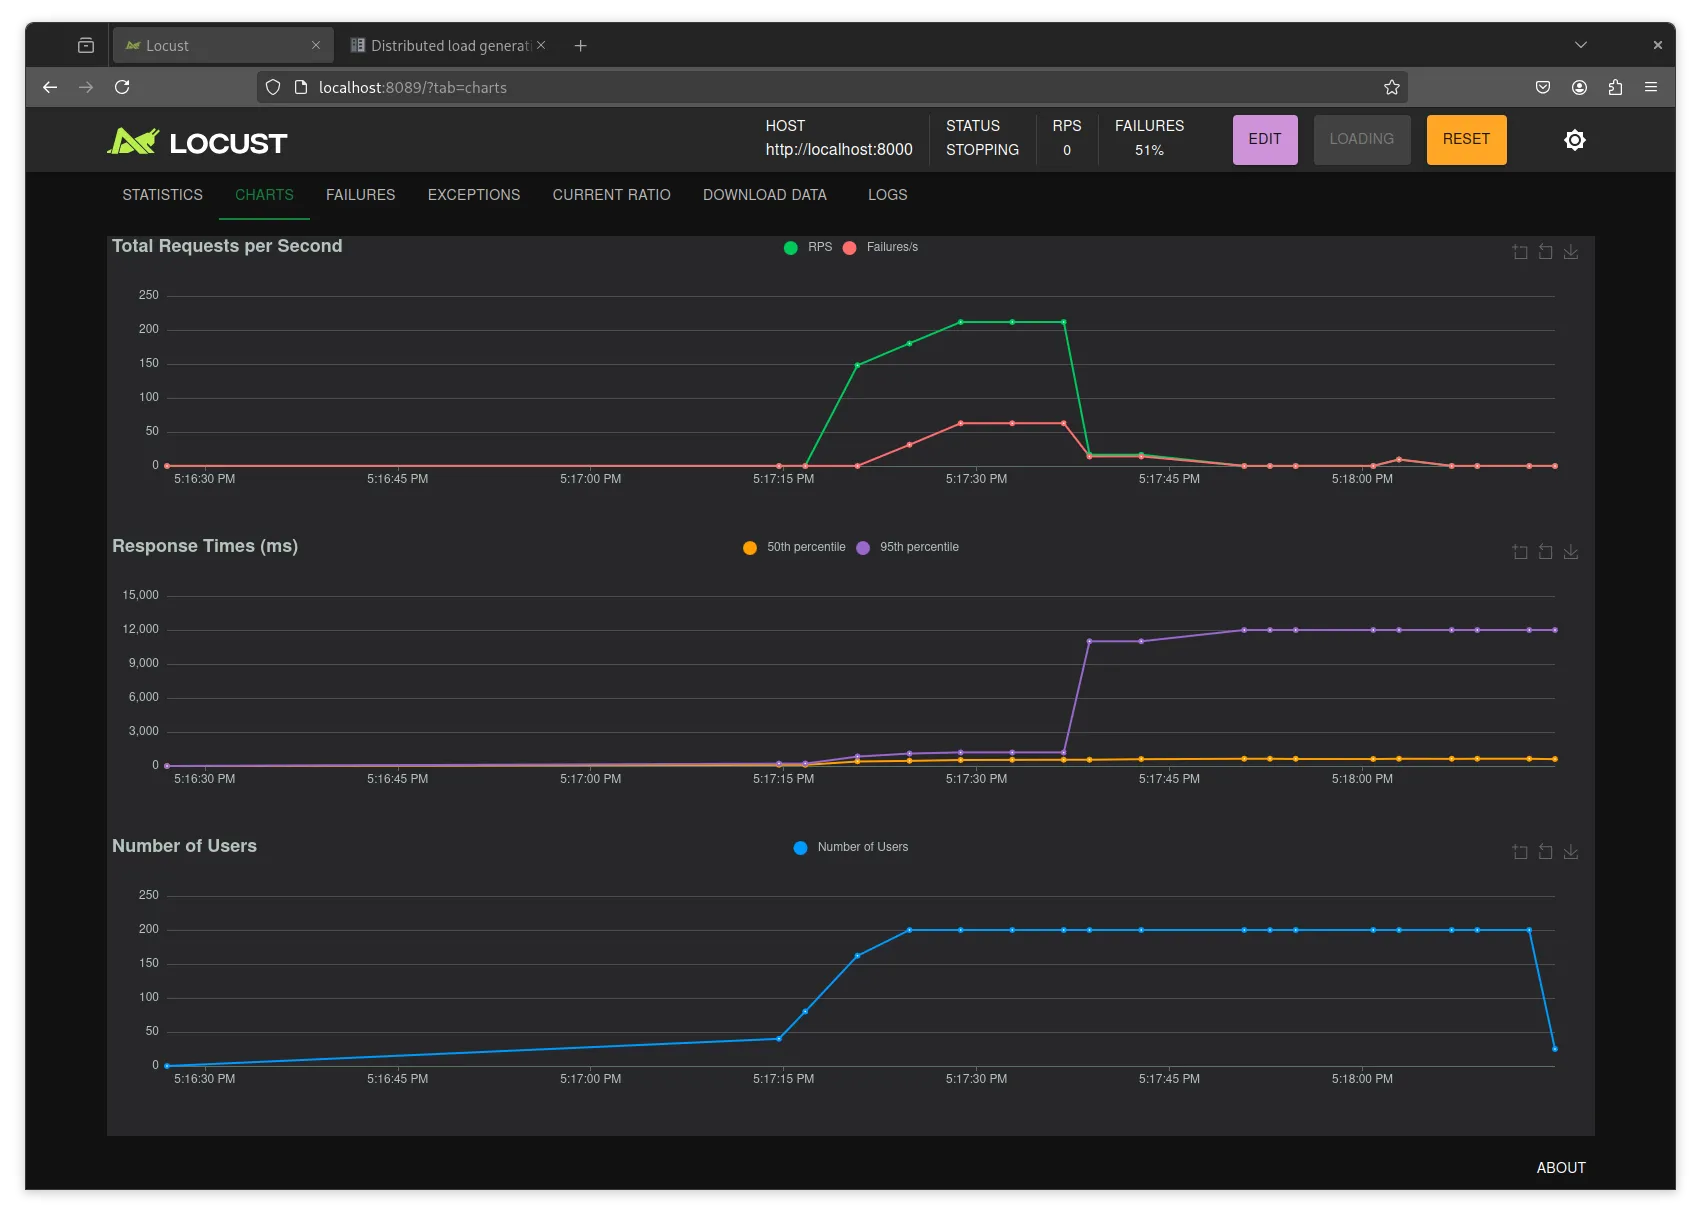
Here we can see, that we start to saturate a bit above 200 RPS (who knows if this is respectable). But after a few hundred connections the server crashes with:
  File "/app/src/example/api.py", line 24, in get_db_connection
    async with await AsyncConnection.connect(str(config.db_dsn)) as conn:
               ^^^^^^^^^^^^^^^^^^^^^^^^^^^^^^^^^^^^^^^^^^^^^^^^^
  File "/app/.venv/lib/python3.12/site-packages/psycopg/connection_async.py", line 135, in connect
    raise last_ex.with_traceback(None)
psycopg.OperationalError: connection failed: connection to server at "172.22.0.2", port 5432 failed: FATAL:  sorry, too many clients already
psycopg is is running into an issue where there are too many clients already connecting to the database. So it would be a better strategy, to have a pool of available connections and use them through the application, instead of creating one per request. Lucky for us psycopg_pool does just that.
Let’s adjust the code to use a pool instead:
# api.py

config = Config()  # type: ignore

pool = AsyncConnectionPool(str(config.db_dsn), open=False)


@asynccontextmanager
async def lifespan(_: FastAPI) -> AsyncGenerator[None, None]:
    """Open and close the connection pool."""
    await pool.open()
    yield
    await pool.close()


app = FastAPI(lifespan=lifespan)


async def get_db_connection() -> AsyncGenerator[AsyncConnection, None]:
    """Get a database connection."""
    async with pool.connection() as conn:
        yield conn

# ...
First we create the Config object once (sad that it becomes a global, but it
should be fair play inside api.py). And we create a connection pool, and bind
its opening and closing to the lifetime of the app.
Then the get_db_connection dependency can just grab a connection from the pool
and run with it.
We run the same locust file with the same command, and then get these results:
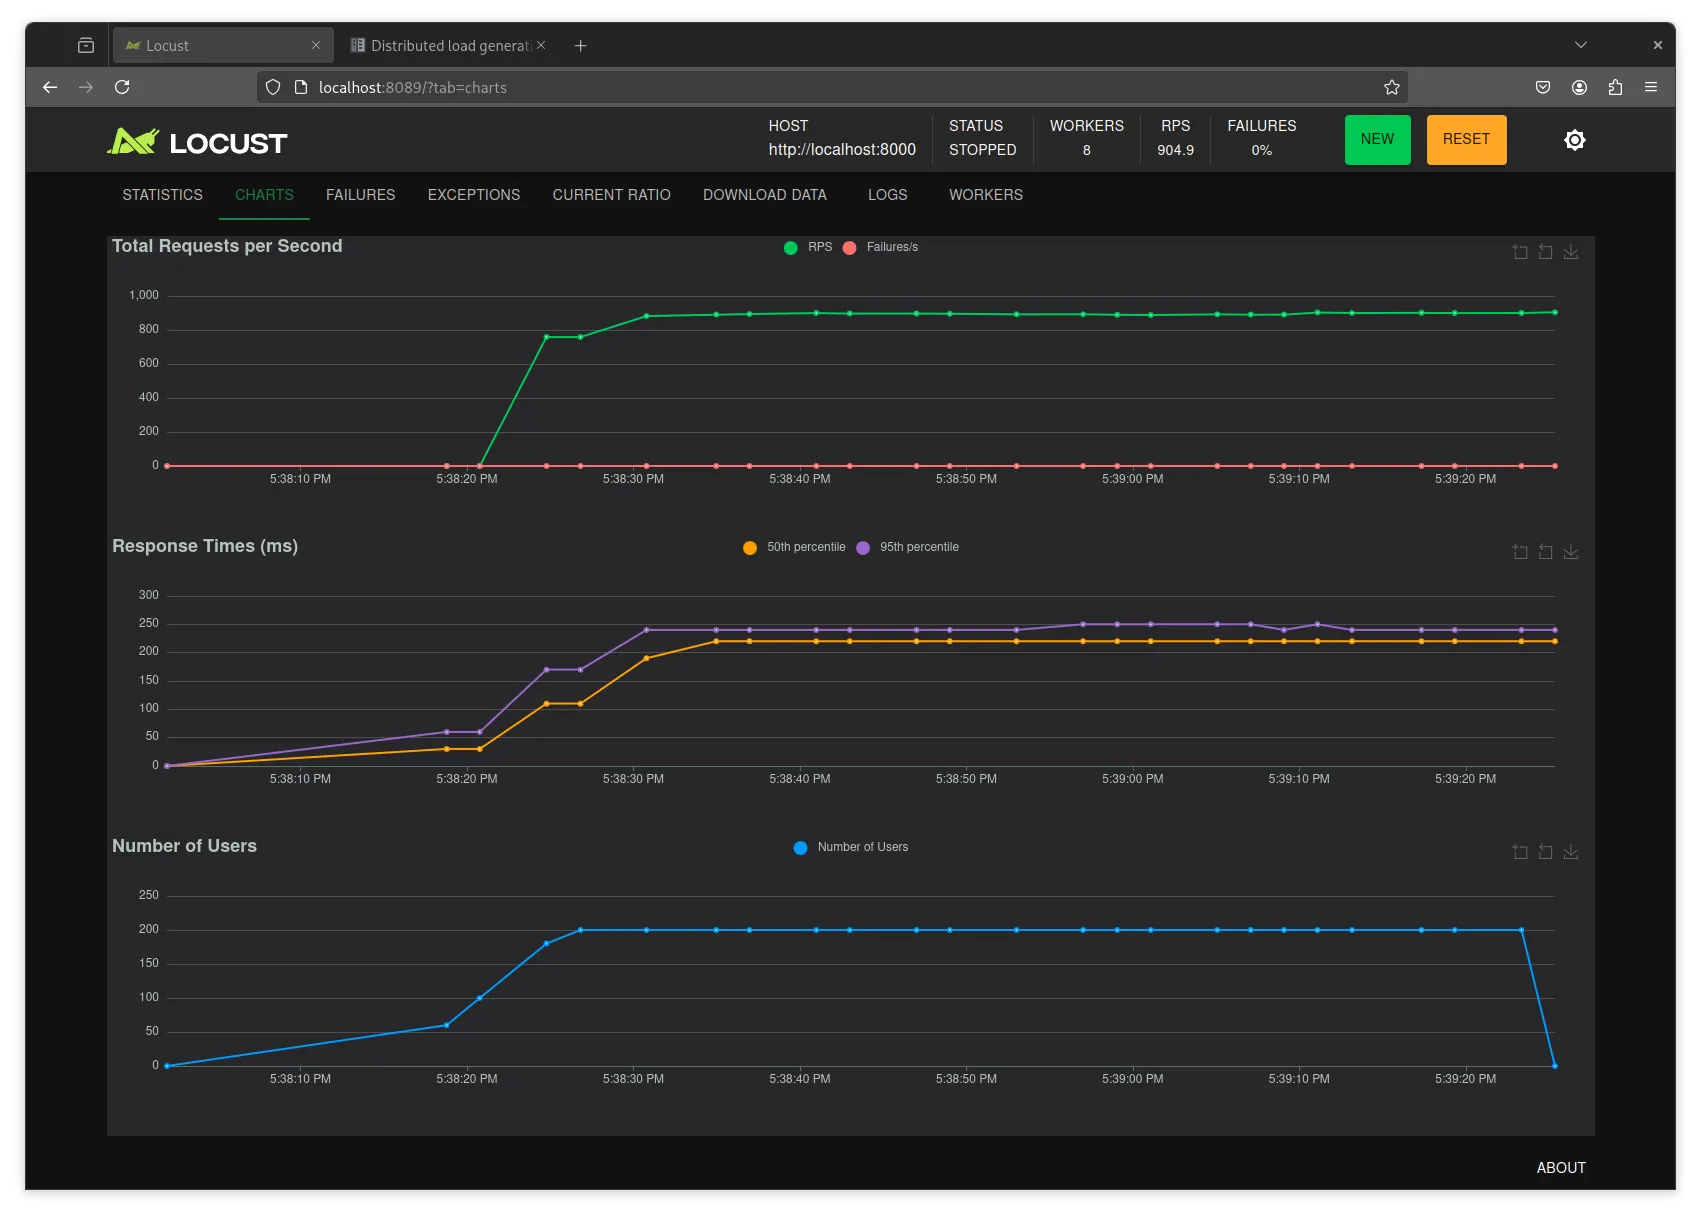
Not only we saturate at a much more reasonable 900 RPS, but we do away with the errors.
For peace of mind, neither locust nor the network card were a limiting factor on this result.
Learnings
There are a few key learnings from this process:
- RPS numbers don’t mean much on their own, but there’s something to be learnt from seeing your application crash, or dramatically change the RPS it can serve.
- Logging might impact the performance of your server, specially when it’s doing “nothing”, like not connecting to a database or doing external requests that might slow the endpoint.
- Pooling your resources is important in concurrent applications, I knew they were, but there’s something guttural about seeing things just crash.